What is needed to open long positions on EUR/USD:
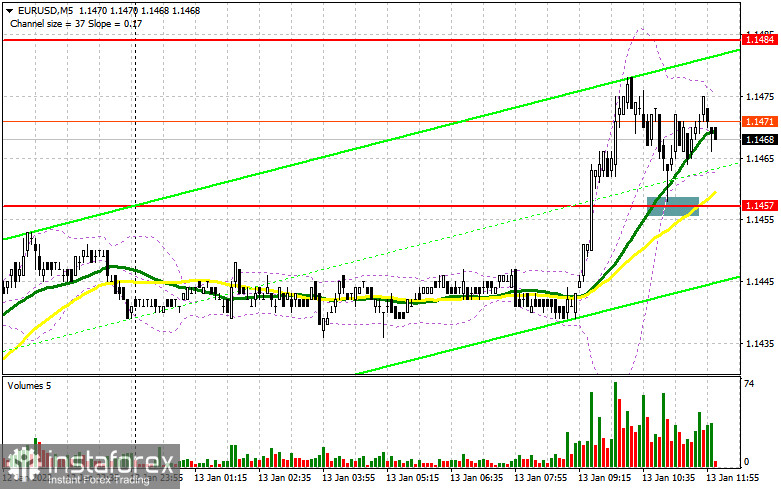
In the morning article, I highlighted the level of 1.1457 and recommended taking decisions with this level in focus. Now let's look at the 5-minute chart and try to figure out what actually happened. After yesterday's strong performance, bulls took only a short break and by the beginning of the European session pushed the pair higher. The breakout and the test of the 1.1457 level downwards indicated an increase in long positions. At the time of writing this article. long traders are still relevant. The pair has already risen from the entry point by about 20 pips. Judging by technical indicators, there might be some crucial changes.
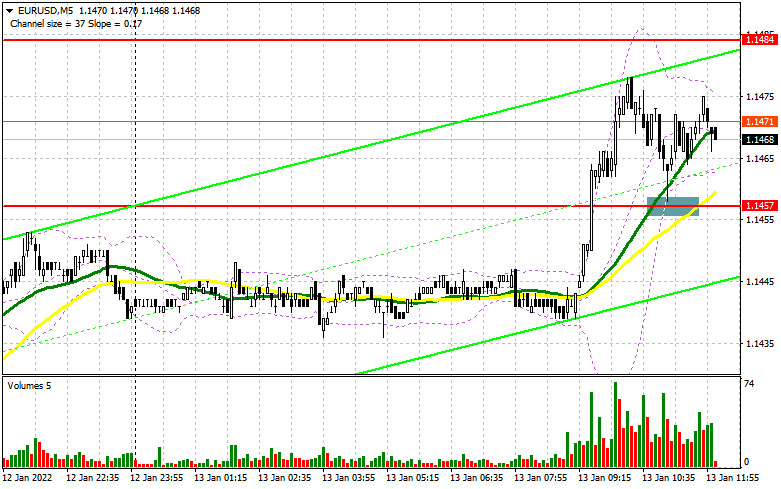
In the afternoon, traders are waiting for speeches of Fed members, which are unlikely to significantly affect the trajectory of the EUR/USD pair. The only thing that may undermine the bullish bias is strong inflation data on producer prices in the United States. If the report turns out to be neutral, EUR/USD is highly likely to grow in the short term. The main task of bulls is to protect the level of 1.1457, which they broke in the first half of the day. The price may test again 1.1484 amid the formation of a false breakout and weak US data. In the morning, the pair failed to hit this level. This is why bulls should push the pair above this level. The downward test will open the way to the levels of 1.1514 and 1.1562 where I recommend profit-taking. A more distant target level is located at 1.1607. If the price tries to test this level, it will signal the strength of a bullish trend. If the pair declines during the US session and bulls fail to push the pair above 1.1457, it would be better not to make hasty decisions but to wait until the price reaches the support level of 1.1429. The moving averages remain in the positive zone near that level. However, I advise you to open long positions after the formation of a false breakdown. It is recommended to open long positions from the 1.1397 level, immediately for a rebound, bearing in mind an upward intraday correction of 20-25 pips.
What is needed to open short positions on EUR/USD:
Bears are trying to regain ground but they are lacking strength. Besides, there are no fundamental reasons for the pair to resume a downward movement. Maybe the statements of Fed policymakers will change the situation. Bears are now counting on strong US PPI data. However, it is highly unlikely. If the figure exceeds economists' forecasts, the US dollar is sure to rise. It could trigger a drop in the EUR/USD pair. If EUR/USD grows during the US session, bears should pay attention to the resistance level of 1.1484. Should the price rise above this level, it will only strengthen the bullish trend. The formation of a false breakout at 1.1484 will give the first entry point into short positions, counting on the decline to the nearest support level of 1.1457. At this level, bulls and bears will try to take control as its breakout may affect bulls' stop orders. It will increase pressure on the euro. A breakout and an upwards test of 1.1457 will give an additional signal to open short positions with the prospect of falling to the low of 1.1429. The moving averages are located in the negative then at that level. If the price decreases below this range, it may slightly change the trend to a downward one. EUR/USD is likely to drop to the lows of 1.1397 and 1.1357 where I recommend profit-taking. If the euro rises and bears lack activity at 1.1484, I would advise you to cancel selling. It is better to open short positions after the formation of a false breakout at the level of 1.1514. The most sensible solution to sell EUR/USD would be selling straight after a rebound from the highs of 1.1562 or 1.1607. Do not forget to allow for a 15-20 pip intraday correction.
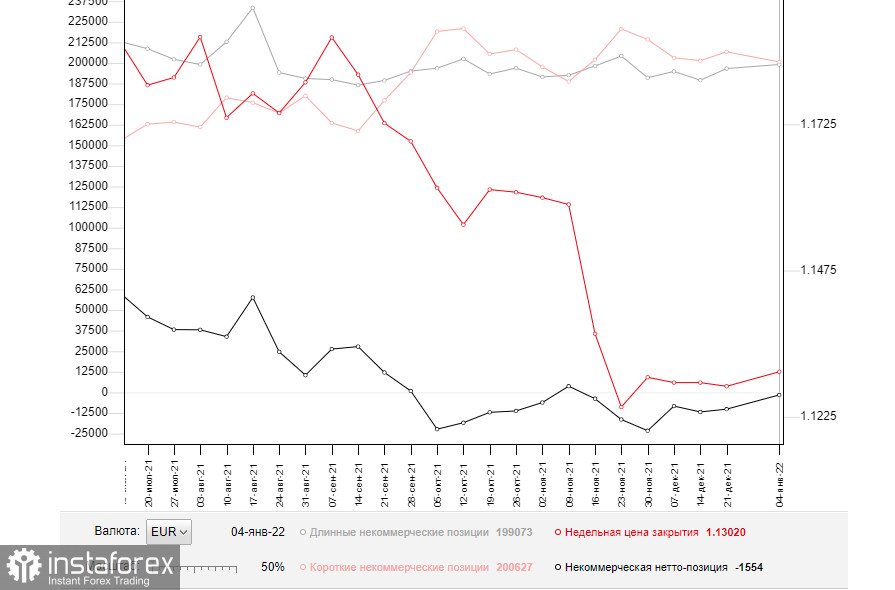
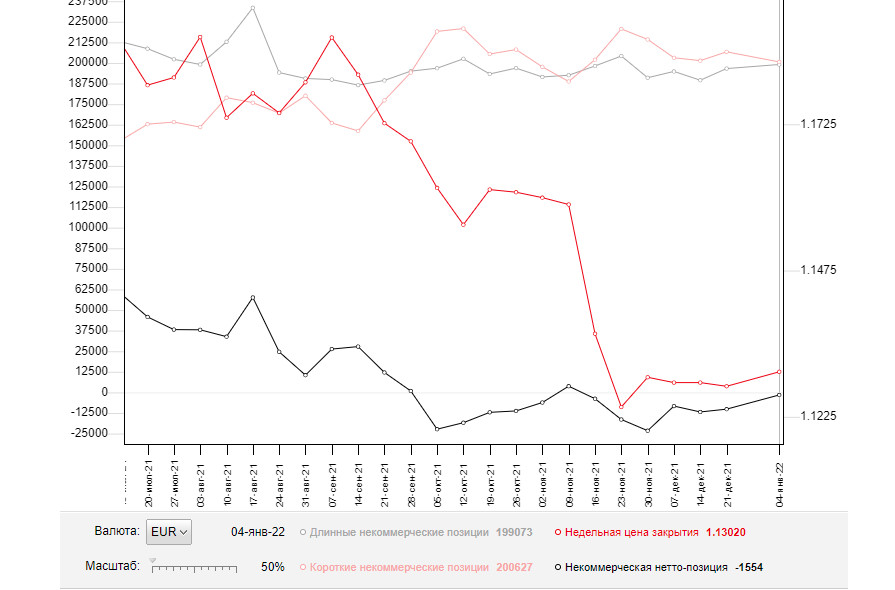
The COT report (Commitment of Traders) for January 4 showed a sharp increase in long positions and a drop in short ones, which led to a change in the negative value of the delta. It might be a signal that the market trend is gradually changing. Demand for the euro is high despite the expected changes in the Fed's monetary policy. This week traders are awaiting the US inflation report, which may provide some hints about how soon the regulator will hike the key rate. The figure is expected to grow above 7% per annum. If so, the Fed is likely to raise the interest rate earlier than planned. Given that the US labor market has not reached yet the target level, analysts assume that the regulator may hike the key rate at least four times this year. Meanwhile, the ECB plans to fully complete its emergency purchase program in March this year. However, the regulator is not going to take other actions aimed at tightening monetary policy, which limits the upward potential of risky assets. The COT report indicates that the number of long non-commercial positions increased to 199,073 from 196,595, while the number of short non-commercial positions fell to 200,627 from 206,757. Traders will continue to increase long positions on the euro betting on the upward correction of the pair. At the end of the week, the total number of non-commercial net positions decreased to -1,554 from -10,162 The weekly closing price rose slightly to 1.1302 against 1.1277 a week earlier.
Signals of technical indicators
Moving averages
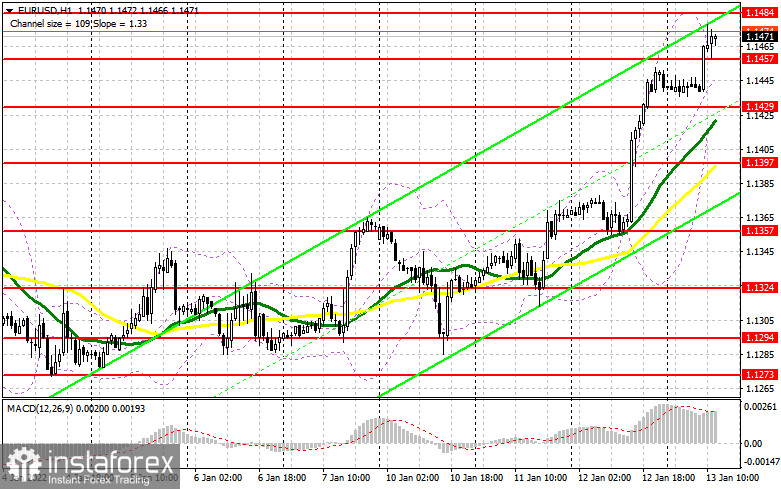
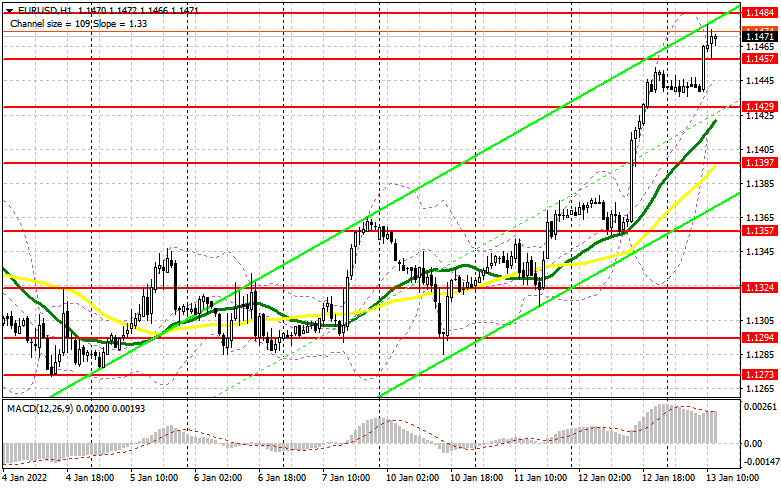
EUR/USD is trading above 30- and 50-period moving averages. It means that the bulls don't give up attempts to carry on with an upward correction.
Remark. The author is analyzing a period and prices of moving averages on the 1-hour chart. So, it differs from the common definition of classic daily moving averages on the daily chart.
Bollinger Bands
A breakout of the upper border at about 1.1484 will trigger a new bullish wave of EUR. In case of a decline, the 1.1400 level will act as support.
Definitions of technical indicators
- Moving average recognizes an ongoing trend through leveling out volatility and market noise. A 50-period moving average is plotted yellow on the chart.
- Moving average identifies an ongoing trend through leveling out volatility and market noise. A 30-period moving average is displayed as the green line.
- MACD indicator represents a relationship between two moving averages that is a ratio of Moving Average Convergence/Divergence. The MACD is calculated by subtracting the 26-period Exponential Moving Average (EMA) from the 12-period EMA. A 9-day EMA of the MACD called the "signal line".
- Bollinger Bands is a momentum indicator. The upper and lower bands are typically 2 standard deviations +/- from a 20-day simple moving average.
- Non-commercial traders - speculators such as retail traders, hedge funds and large institutions who use the futures market for speculative purposes and meet certain requirements.
- Non-commercial long positions represent the total long open position of non-commercial traders.
- Non-commercial short positions represent the total short open position of non-commercial traders.
- The overall non-commercial net position balance is the difference between short and long positions of non-commercial traders.