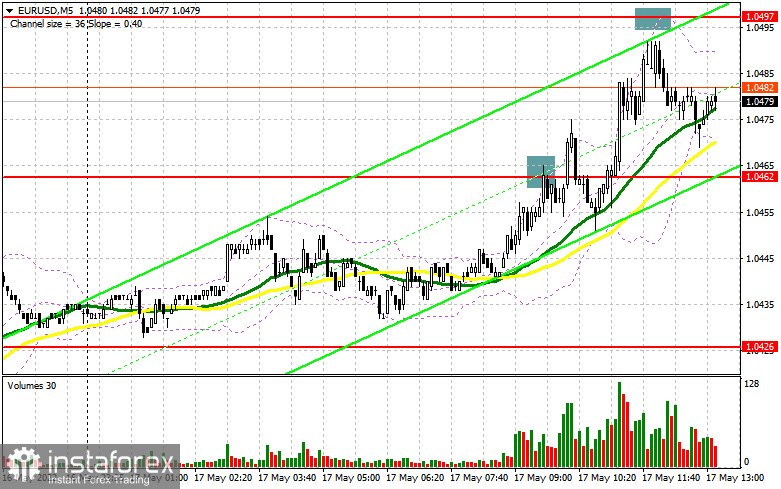
In the morning article, I highlighted the level of 1.0462 and recommended taking decisions with this level in focus. Now let's look at the 5-minute chart and try to figure out what actually happened. The eurozone's GDP for the first quarter turned out to be better than economists' forecasts. It strengthened the bullish sentiment on the euro. A sell signal appeared after a false breakout of 1.0462 at the very beginning of the European session. However, this signal brought losses. The euro lacked just a few pips in order to approach the resistance level of 1.0497. So, traders abandoned short positions at this level as well as long ones at 1.0462. Traders did not open them because of the absence of a downward test at this level.
What is needed to open long positions on EUR/USD
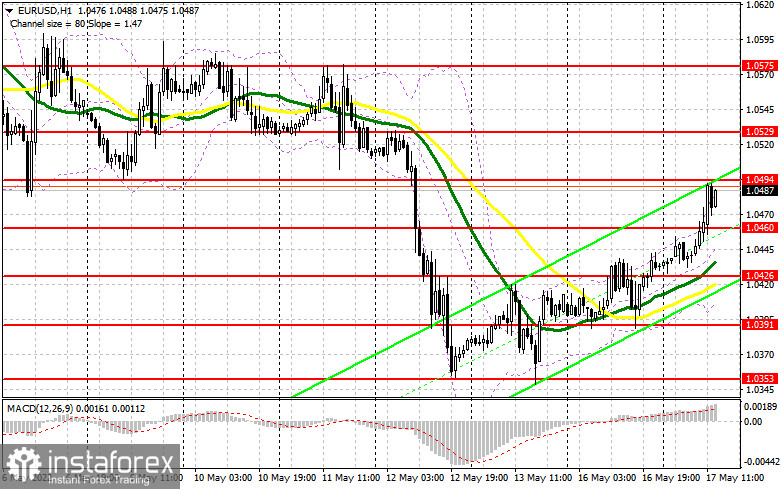
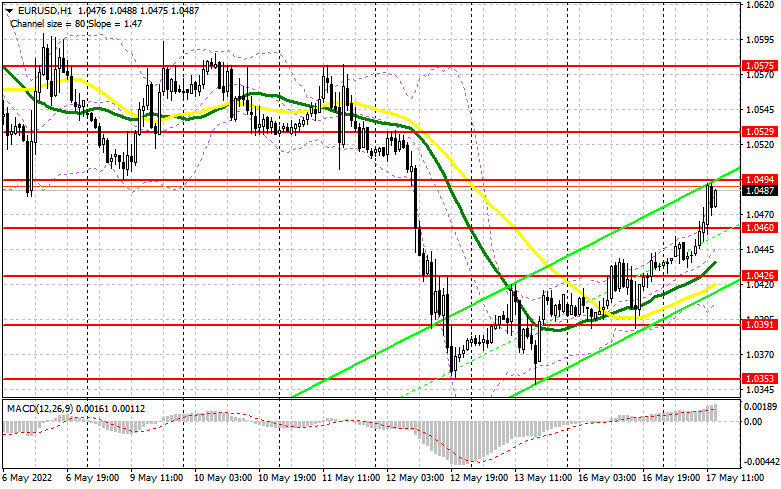
Some analysts are now sure that the ECB may raise the interest rate three times this year. Such predictions boost the European currency. Sellers stay away from the market at every breakout of the nearest resistance levels. Today's US retail sales report for April could determine whether the euro will be able to perform an upward reversal. Weak figures will indicate a likely decrease in inflationary pressure. If so, the Fed will have a chance to slightly soften its stance. It will also undermine demand for the US dollar, stirring risk appetite. In the afternoon, ECB President Christine Lagarde and Fed Chair Jerome Powell. will give speeches. Their statements may lead to a surge in volatility. However, as seen on the chart, the market seems to have already chosen the trajectory. If the euro/dollar pair declines after the US data, only a false breakout of 1.0460 will give a good entry point into long positions within the upward correction. It will also signal high demand for the euro amongretail traders. Now, speculators are betting on a breakout of 1.0494 as it will erase the sellers' stop orders. It could also strengthen the upward movement of the euro. A drop above 1.0494 may occur if Powell and Lagarde's speeches do not contain anything new. A breakout and a downward test of 1.0494 will give a new buysignal. It will strengthen the bullish bias. It may open the way to 1.0529 where I recommend locking in profits. A more distant target will be the 1.0575 level. If the euro/dollar pair drops and bulls show no activity at 1.0460, it is better to open long positions after a false breakout near the low of 1.0426. The moving averages are passing in the positive territory at this level. However, I would advise you to buy the euro at this level only after a false breakout. It is possible to open long positions immediately for a rebound from 1.0391 or even a lower low around 1.0353, keeping in mind an upward intraday correction of 30-35 pips.
What is needed to open short positions on EUR/USD
Bears tried to regain the upper hand but failed. The primary task of sellers for the second half of the day is to protect the new resistance level of 1.0494. A breakout of this level will significantly undermine the bearish sentiment. So, they may lose control over the market. The return of the pair to the support level of 1.0460 also remains quite an important task. A breakout and an upward test of 1.0460 during the release of US data, or after a speech of FOMC representatives could generate an additional sell signal. If so, the pair may drop to swing lows of 1.0426 and 1.0391 where I recommend locking in profits. In case of talks about more aggressive measures by the Fed, the pair is likely to slip to 1.0353, which will put an end to the bulls' attempts to build an uptrend. If EUR/USD rises after US data, it is better to open short positions only after a false breakout of the resistance level of 1.0494, similar to the scenario I discussed above. If bears show no energy at this level, a sharp upward reversal is likely. If this scenario comes true, it would be appropriate to open short positions after a false breakout of 1.0529. You can sell EUR/USD immediately on a rebound from 1.0575, keeping in mind a downward intraday correction of 30-35 pips.
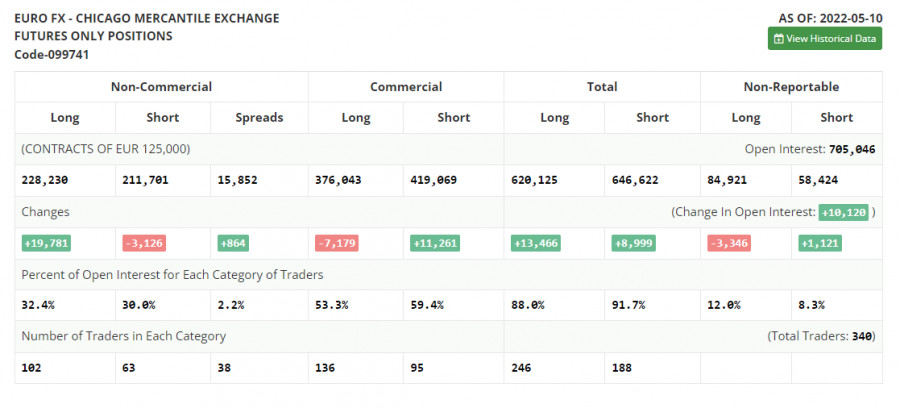
COT report
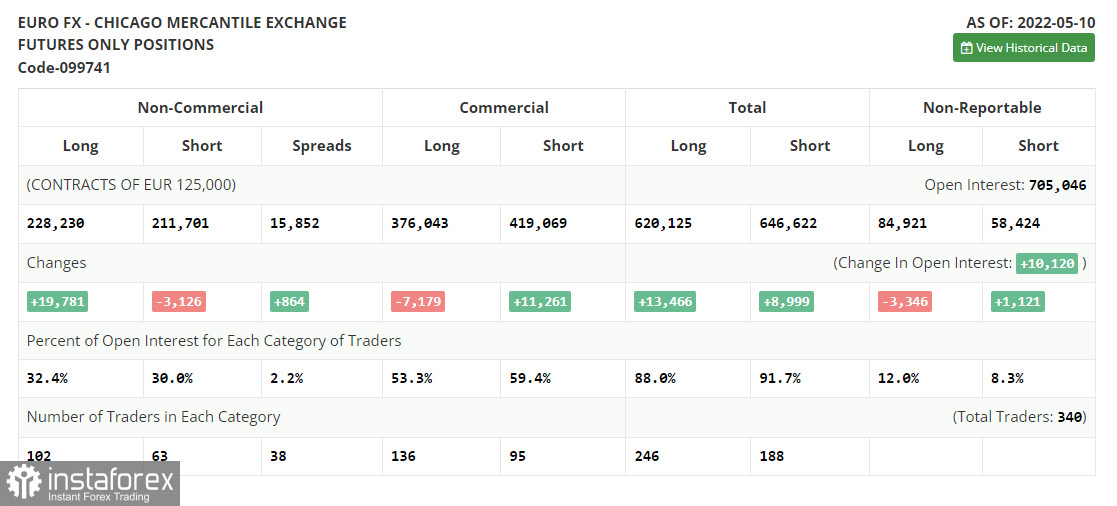
The COT report (Commitment of Traders) for May 10 logged a sharp increase in long positions and a drop in short ones. The euro's oversold status indicates interest from traders and investors. ECB policymakers' recent statements fueled optimism that the euro may be able to start an upward cycle. The ECB is widely expected to raise the key rate by a quarter-point in July this year, then in September and in December, bringing it to 0.25% by the end of the year. The next rate hikes will follow in September and in December from the current zero level to 0.5%. Such an aggressive tightening will help euro bulls to find the bottom in the near future. However, the US Fed alongside escalating geopolitical tensions might derail such plans. The US regulator sticks to aggressive monetary policy tightening. Some analysts believe that at the next meeting the central bank may raise the key rate by 0.75%. This scenario gives a clear signal to buy the US dollar in the medium term. The COT report revealed that long non-commercial positions jumped by 19,781 from 208,449 to 228,230, while short mom-commercial positions dropped by 3,126 from 214,827 to 211,701. As I have already noted, the low rate of the euro makes it more attractive for traders. Currently, we see that more buyers are entering the market. At the end of the week, the total non-commercial net position increased to 16,529 against a negative indicator of -6,378 a week earlier. The weekly closing price remained practically unchanged at 1.0546 versus 1.0545.
Signals of technical indicators
Moving averages
EUR/USD is trading slightly above 30- and 50-period moving averages. It means that the bulls don't give up attempts to carry on with an upward correction.
Remark. The author is analyzing the period and prices of moving averages on the 1-hour chart. So, it differs from the common definition of classic daily moving averages on the daily chart.
Bollinger Bands
In case of a decline, 1.0445 will act as support.
Definitions of technical indicators
- Moving average recognizes an ongoing trend through leveling out volatility and market noise. A 50-period moving average is plotted
- yellow on the chart.
- Moving average identifies an ongoing trend through leveling out volatility and market noise. A 30-period moving average is displayed as the green line.
- MACD indicator represents a relationship between two moving averages that is a ratio of Moving Average Convergence/Divergence. The
- MACD is calculated by subtracting the 26-period Exponential Moving Average (EMA) from the 12-period EMA. A 9-day EMA of the MACD called the "signal line".
- Bollinger Bands is a momentum indicator. The upper and lower bands are typically 2 standard deviations +/- from a 20-day simple moving average.
- Non-commercial traders - speculators such as retail traders, hedge funds, and large institutions who use the futures market for speculative purposes and meet certain requirements.
- Non-commercial long positions represent the total long open position of non-commercial traders.
- Non-commercial short positions represent the total short open position of non-commercial traders.
- The overall non-commercial net position balance is the difference between short and long positions of non-commercial traders.