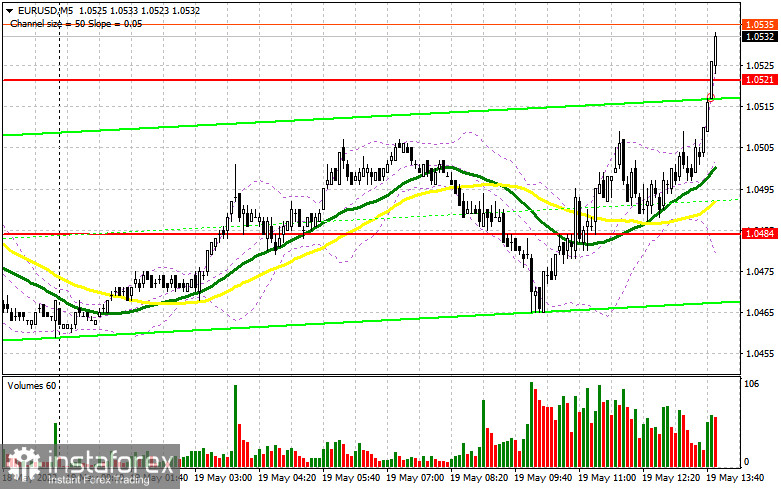
In the morning article, I highlighted the level of 1.0484 and recommended taking decisions with this level in focus. Now let's look at the 5-minute chart and try to figure out what actually happened. As the economic calendar was uneventful, bears took the chance to regain control. However, they failed to push the pair below 1.0484. After a breakout and an unsuccessful upward test of this level, the euro/dollar pair returned to 1.0484. There was no appropriate buy signal too. Now, traders are anticipating the release of the ECB meeting minutes.
What is needed to open long positions on EUR/USD
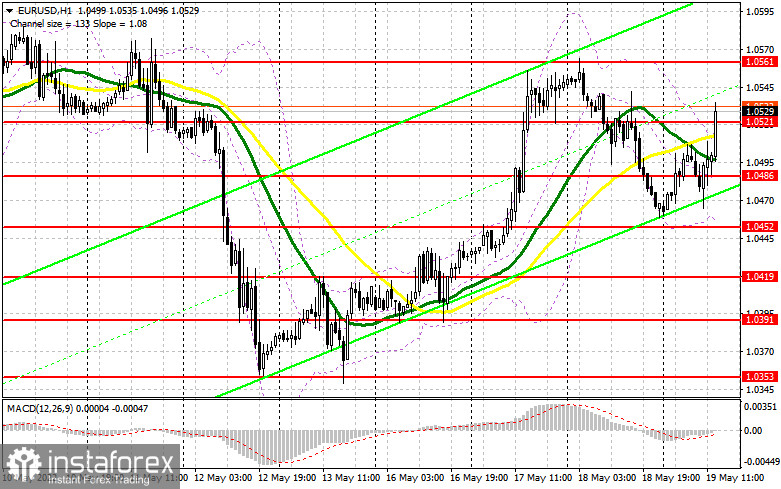
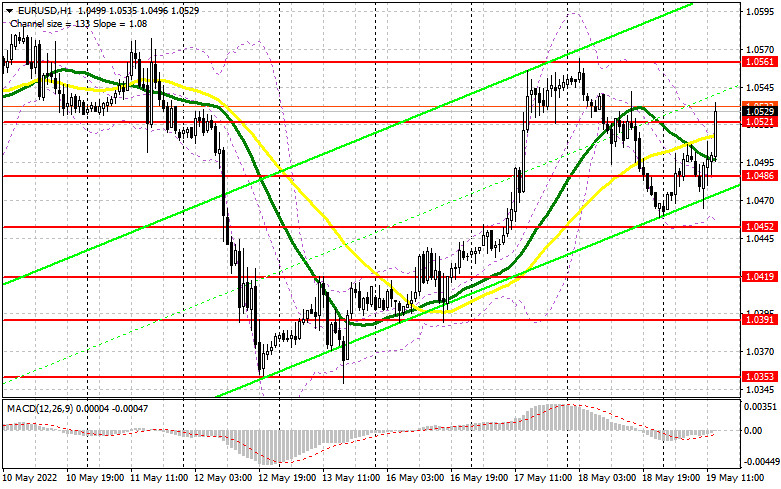
In the afternoon, the technical outlook changed. The publication of the ECB meeting minutes will hardly hurt the bullish sentiment. Yet, it is also unlikely to help bulls boost the pair. For this reason, the price may return to the weekly high of 1.0561. Before that, they should defend the nearest support level of 1.0521, formed during the European session. If the US initial jobless claims and the Philadelphia Manufacturing Index reports turn out to be disappointing, there could be a false breakout of 1.0521. The moving averages are passing in the positive zone slightly below this level. It will give a good entry point into long positions within the upward correction. Bulls are likely to make another attempt to push the price above the resistance level of 1.0561. This is a strong level formed a few days earlier. Notably, this level may be broken quite quickly. If so, it will signal the formation of a new bull trend with an upward target of 1.0640. A breakout and a downward test of 1.0561 will give a new buy signal. It will also strengthen the bullish sentiment. As a result, the pair rise to 1.0602 where I recommend locking in profits. A more distant target will be the 1.0640 level. In case of a decline and the absence of bulls at 1.0521, the pressure on the euro is likely to increase. The pair is sure to slide into the sideways channel. If this scenario comes true, it is better to open long positions only after a false breakout near the low of 1.0486. It is also possible to open long positions on the euro immediately at a bounce from 1.0419 or even a low around 1.0391, keeping in mind an upward intraday correction of 30-35 pips.
What is needed to open short positions on EUR/USD
Despite several strong attempts, bears failed to push the pair to yesterday's lows. It is too early to panic as positive US economic data and the dovish tone of the ECB meeting minutes may increase pressure on the euro. Even if this scenario does not come true, bears will fight for the resistance level of 1.0561. Currently, the import task is not to lose what they have. For this reason, they should push the pair below the nearest support level of 1.0521. A breakout and an upward test of this level during the release of US data may generate an additional sell signal. If so, the pair may approach the lows around 1.0486 and 1.0452 where I recommend locking in profits. If EUR/USD rises after the publication of US data, it is better to open short positions after a false breakout of the resistance level of 1.0561. If bears fail to defend this level, a sharp upward reversal may occur. It will cement the bullish trend. If so, it is recommended to open short positions after a false breakout of 1.0602. You can sell EUR/USD immediately at a bounce from 1.0640, keeping in mind a downward intraday correction of 30-35 pips.
COT report
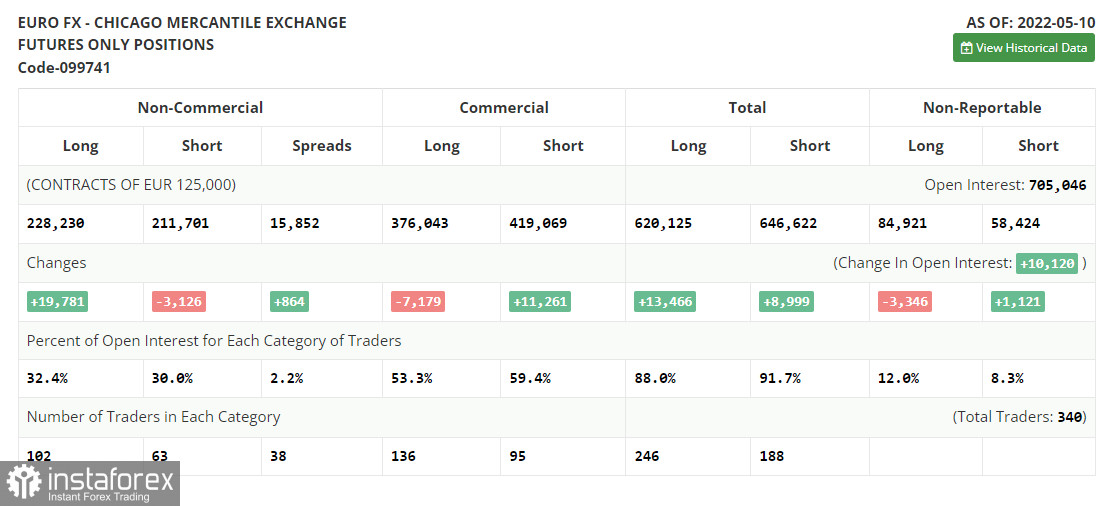
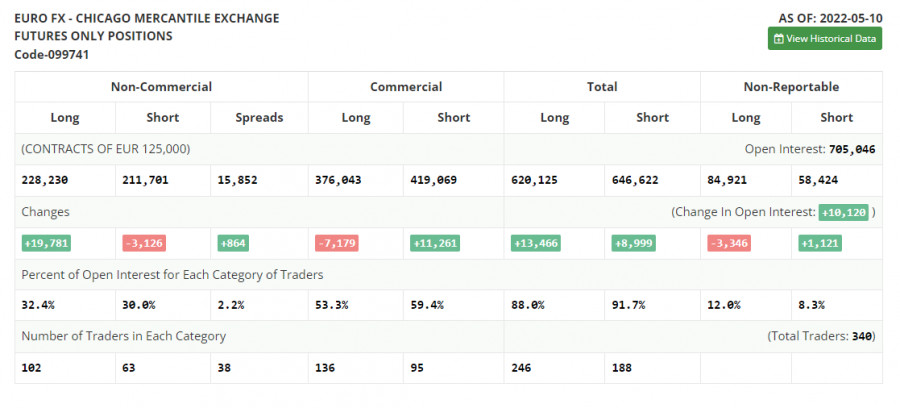
The COT report (Commitment of Traders) for May 10 logged a sharp increase in long positions and a drop in short ones. The euro's oversold status indicates interest from traders and investors. ECB policymakers' recent statements fueled optimism that the euro may be able to start an upward cycle. The ECB is widely expected to raise the key rate by a quarter-point in July this year, then in September and in December, bringing it to 0.25% by the end of the year. The next rate hikes will follow in September and in December from the current zero level to 0.5%. Such an aggressive tightening will help euro bulls to find the bottom in the near future. However, the US Fed alongside escalating geopolitical tensions might derail such plans. The US regulator sticks to aggressive monetary policy tightening. Some analysts believe that at the next meeting the central bank may raise the key rate by 0.75%. This scenario gives a clear signal to buy the US dollar in the medium term. The COT report revealed that long non-commercial positions jumped by 19,781 from 208,449 to 228,230, while short mom-commercial positions dropped by 3,126 from 214,827 to 211,701. As I have already noted, the low rate of the euro makes it more attractive for traders. Currently, we see that more buyers are entering the market. At the end of the week, the total non-commercial net position increased to 16,529 against a negative indicator of -6,378 a week earlier. The weekly closing price remained practically unchanged at 1.0546 versus 1.0545.
Signals of technical indicators
Moving averages
EUR/USD is trading near 30- and 50-period moving averages. It means that bulls and bears are tussling for market control.
Remark. The author is analyzing the period and prices of moving averages on the 1-hour chart. So, it differs from the common definition of classic daily moving averages on the daily chart.
Bollinger Bands
In case of a decline, the lower border around 1.0452 will act as support.
Definitions of technical indicators
- Moving average recognizes an ongoing trend through leveling out volatility and market noise. A 50-period moving average is plotted yellow on the chart.
- Moving average identifies an ongoing trend through leveling out volatility and market noise. A 30-period moving average is displayed as the green line.
- MACD indicator represents a relationship between two moving averages that is a ratio of Moving Average Convergence/Divergence. The
- MACD is calculated by subtracting the 26-period Exponential Moving Average (EMA) from the 12-period EMA. A 9-day EMA of the MACD called the "signal
- line".
- Bollinger Bands is a momentum indicator. The upper and lower bands are typically 2 standard deviations +/- from a 20-day simple moving average.
- Non-commercial traders - speculators such as retail traders, hedge funds, and large institutions who use the futures market for speculative purposes and meet certain requirements.
- Non-commercial long positions represent the total long open position of non-commercial traders.
- Non-commercial short positions represent the total short open position of non-commercial traders.
- The overall non-commercial net position balance is the difference between short and long positions of non-commercial traders.