Analysis of EUR/USD 5M
The EUR/USD currency pair declined for most of Wednesday but recovered nearly all its losses by the end of the day. Essentially, the euro returned to its level before the release of crucial U.S. labor market data. We had warned that this week might see "flights" in both directions, alternating constantly. For example, the pair's rise on Tuesday can be easily attributed to negative macroeconomic data from across the ocean. However, explaining why the euro fell on Wednesday night and for most of the day is much more challenging. It can be hypothesized that the pound sterling pulled the euro down, as an inflation report from the UK was published that should have prompted a fall in the British currency. Nonetheless, the euro rebounded quickly, just like the pound. We believe this is entirely fair and logical.
From a technical standpoint, the hourly timeframe remains in an upward trend, suggesting the pair could continue its expected growth. If it can break through the area of 1.1800-1.1830, the flat trend will officially conclude, and the upward trend of 2025 will resume. This is the scenario we anticipate after six months in the sideways channel between 1.1400 and 1.1830.
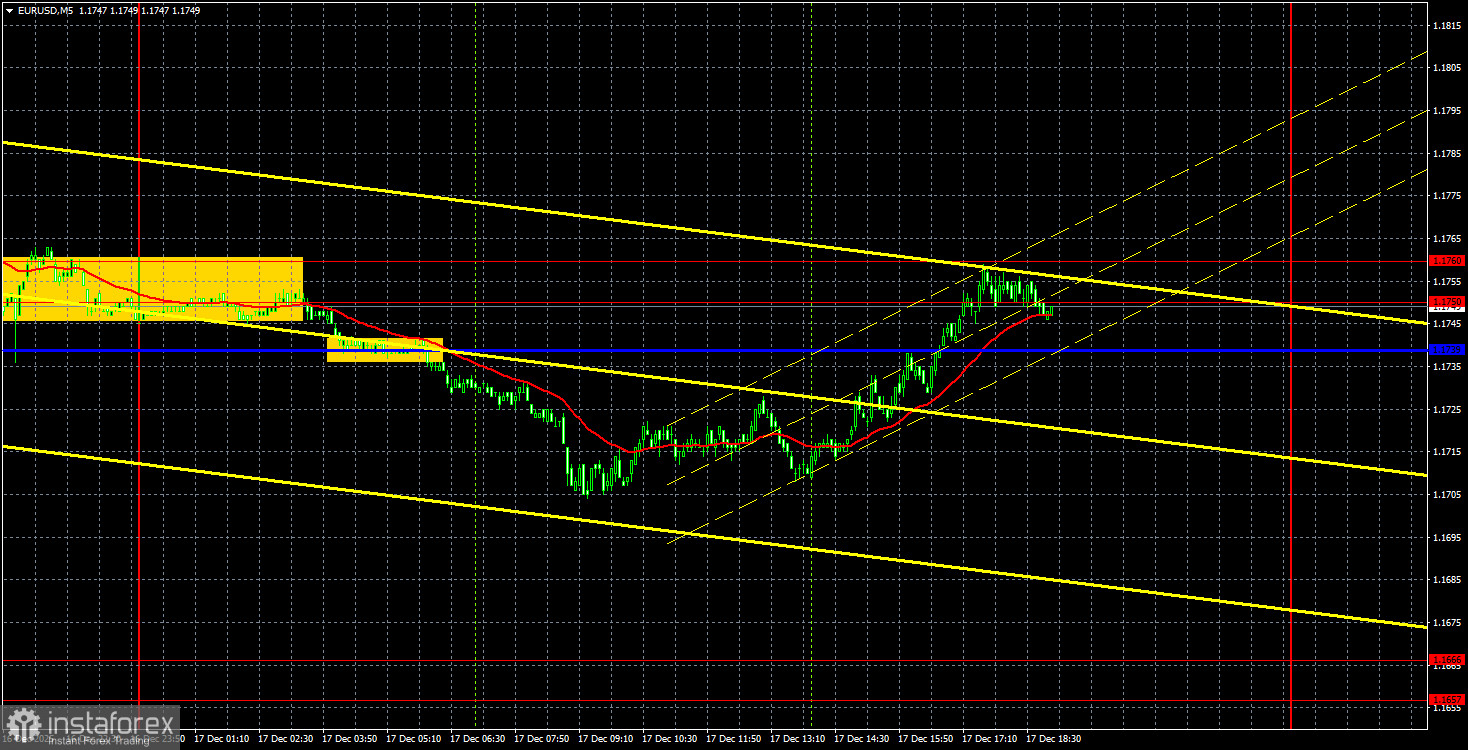
In yesterday's 5-minute timeframe, one sell signal was generated. The price consolidated below the critical line half an hour before the start of the European trading session, which allowed traders to enter short positions. However, the pair could not reach the target level of 1.1666 and returned to its starting positions by the end of the day. It seems we are expecting a new attempt to break out of the flat trend in the daily timeframe.
COT Report
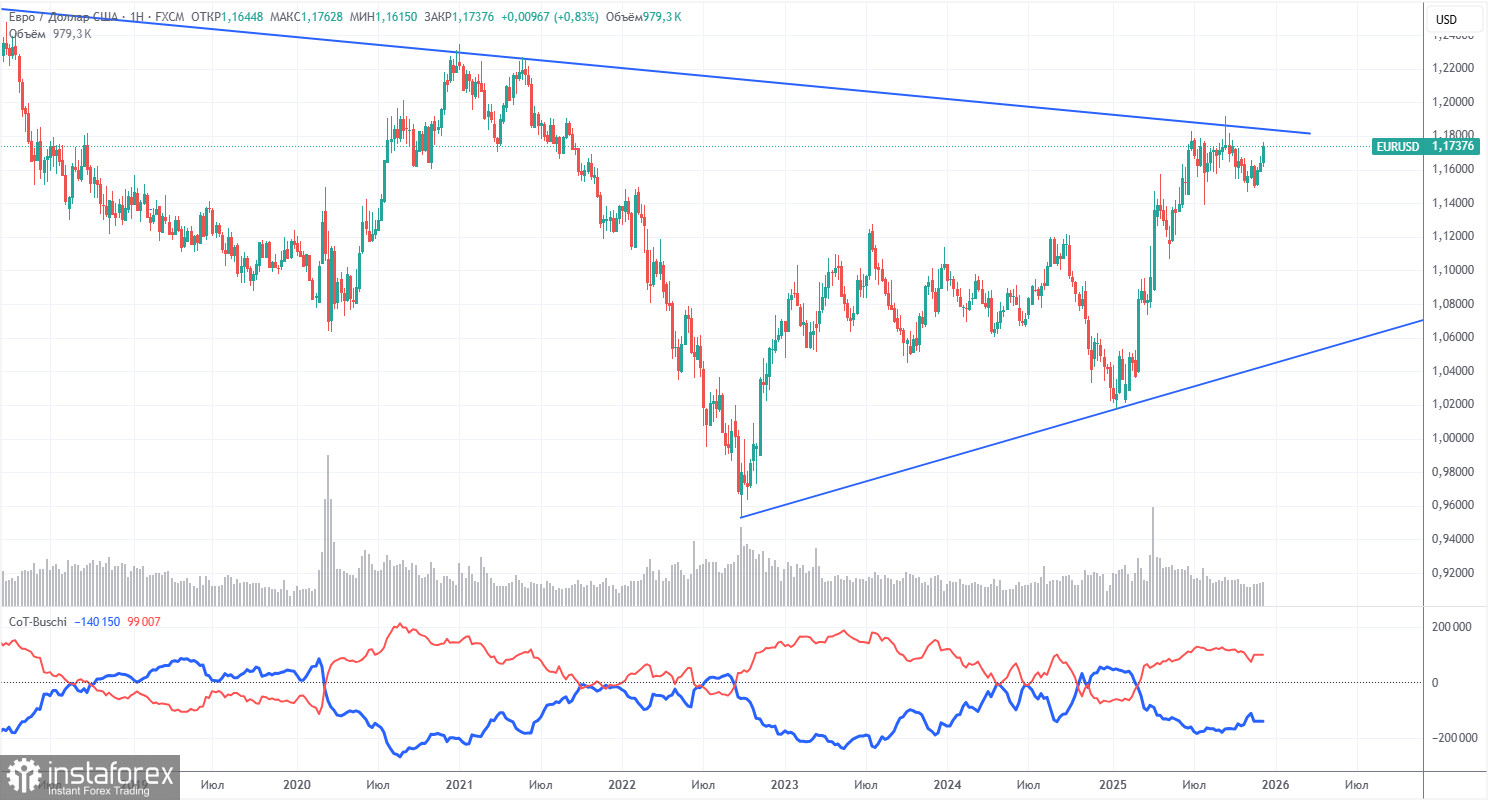
The latest COT report was released last week and is dated November 18, which means it is still outdated. As shown in the illustration above, the net position of non-commercial traders has been "bullish" for an extended period, with bears struggling to enter the zone of their own superiority at the end of 2024 but quickly losing it. Since Trump took office as President of the United States for the second time, the dollar has only experienced declines. We cannot say with 100% certainty that the dollar's decline will continue, but current global developments hint at that possibility.
We still do not see any fundamental factors supporting the strengthening of the euro, while there remain plenty of factors supporting the decline of the dollar. The global downward trend is still in place, but what relevance does the direction the price has taken over the last 17 years hold now? The dollar could rise again if the overall fundamental picture changes, but there are currently no signs of that.
The indicator's red and blue lines continue to suggest a "bullish" trend. Over the last reporting week, the number of longs in the "Non-commercial" group increased by 8,000, while the number of shorts decreased by 17,400. Consequently, the net position grew by 25,400 contracts over the week. However, these figures remain outdated and insignificant.
Analysis of EUR/USD 1H
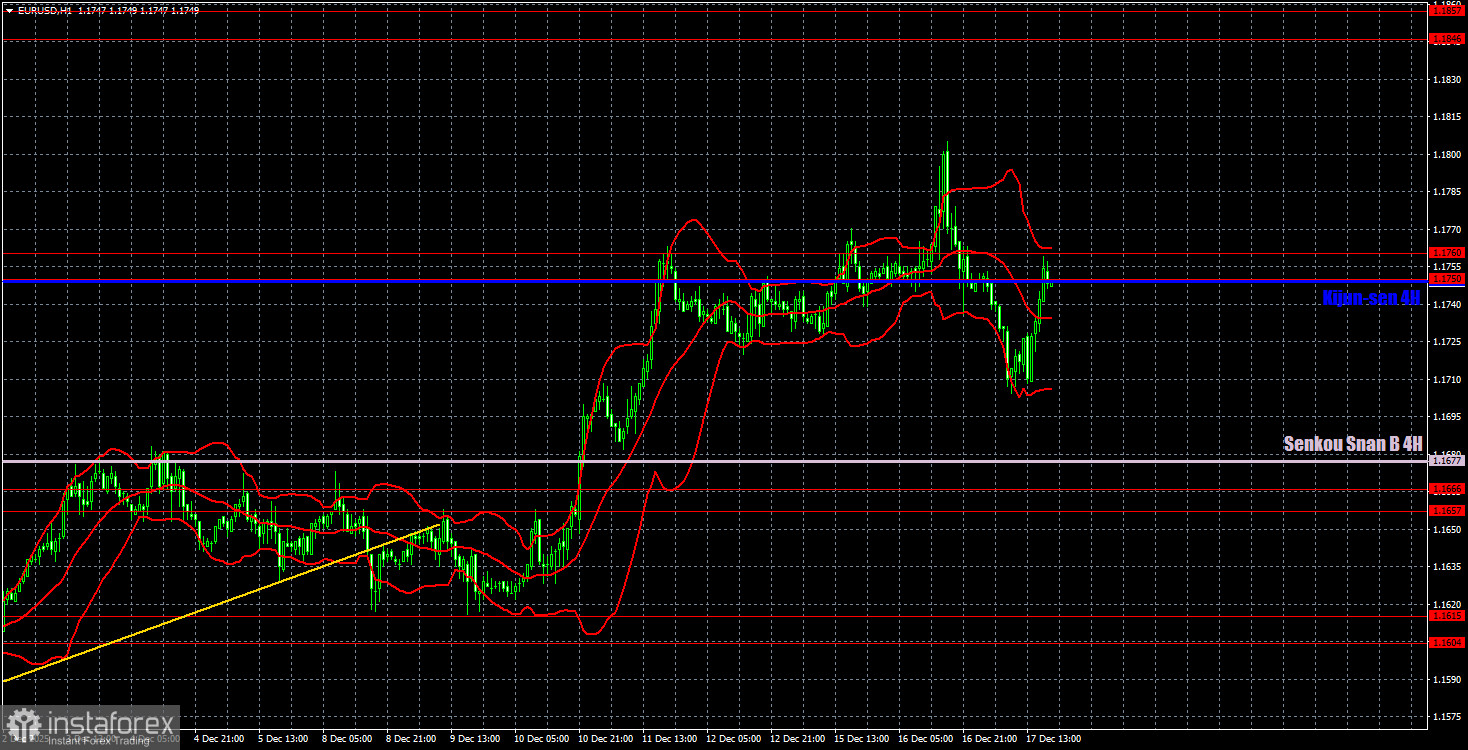
On the hourly timeframe, the EUR/USD pair continues its upward movement, which aligns with our expectations. However, the upper line of the sideways channel at 1.1400-1.1830 has been reached, and we can now observe a technical decline, as the flat is still maintained in the daily timeframe. Essentially, we saw a reversal at the upper boundary of the channel yesterday, which suggests a pullback to the lower level is quite possible, but we still believe the upward trend will continue.
For December 18, we highlight the following trading levels: 1.1234, 1.1274, 1.1362, 1.1426, 1.1542, 1.1604-1.1615, 1.1657-1.1666, 1.1750-1.1760, 1.1846-1.1857, 1.1922, 1.1971-1.1988, as well as the Senkou Span B line (1.1677) and Kijun-sen line (1.1749). The Ichimoku indicator lines may shift throughout the day, which needs to be considered when determining trading signals. Don't forget to set Stop Loss orders to break even if the price moves in your favor by 15 pips. This will guard against potential losses if the signal turns out to be false.
On Thursday, the Europeran Centeral Bank meeting is scheduled in the EU, and in the U.S., the inflation report will be published. We consider both events significant, but it should be understood that the ECB is unlikely to make any important decisions. The December meeting may turn out to be uneventful, as there is no need to change monetary policy parameters.
Trading Recommendations:
On Thursday, traders may consider trading from the 1.1750-1.1760 area. A price rebound from this area will make short positions relevant, targeting the Senkou Span B line. If it consolidates above this area, it will lead to another attempt to break out of the sideways channel of 1.1400-1.1830 through the upper boundary. In this case, long positions will become relevant.
Explanations for Illustrations:
- Support and resistance price levels are marked by thick red lines, where movement may conclude. They are not sources of trading signals.
- The Kijun-sen and Senkou Span B lines are Ichimoku indicator lines transferred to the hourly timeframe from the 4-hour timeframe. They are robust lines.
- Extremum levels are marked by thin red lines, where the price previously bounced. They are sources of trading signals.
- Yellow lines represent trend lines, trend channels, and any other technical patterns.
- Indicator 1 on the COT charts shows the size of the net position of each category of traders.