Trade Analysis for Friday:
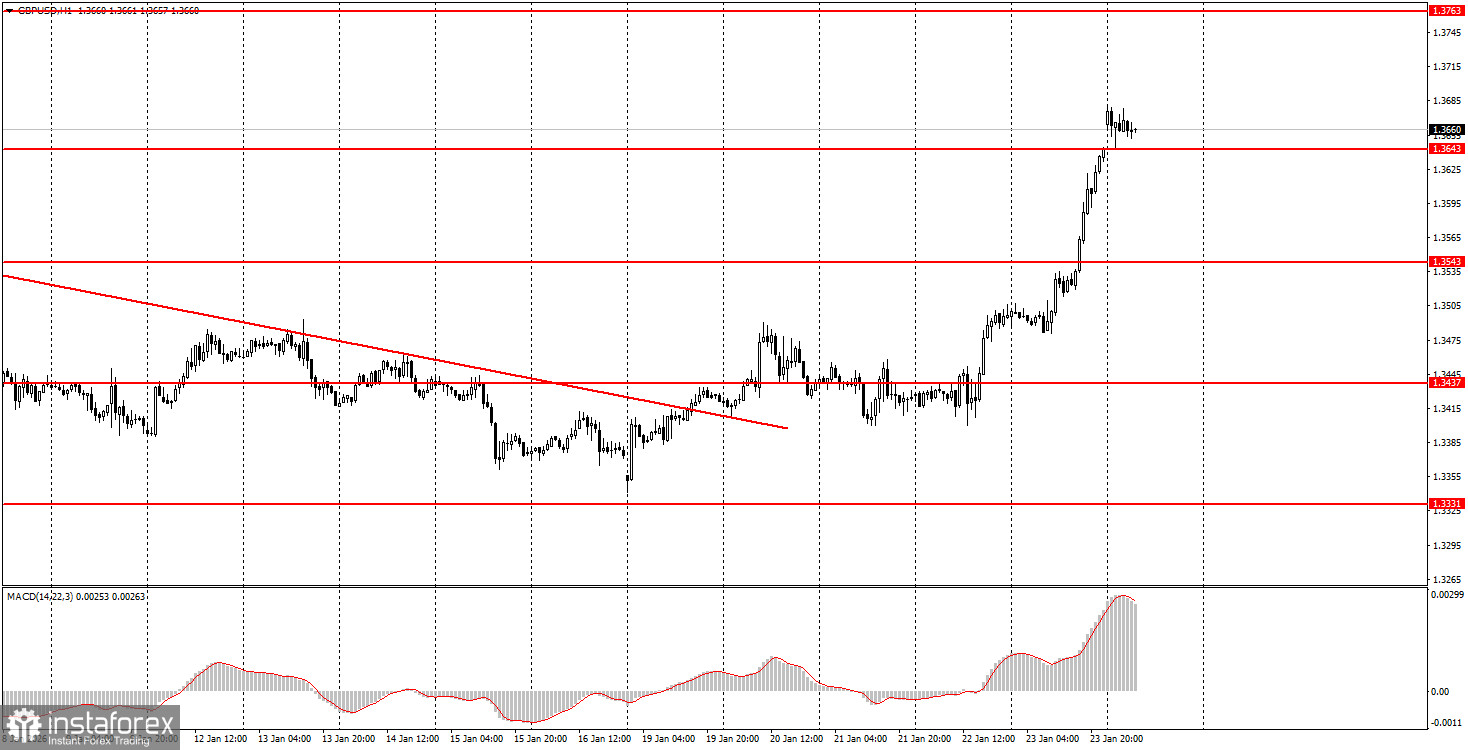
1H Chart of GBP/USD
The GBP/USD pair showed strong upward movement on Friday, primarily driven by the fundamental backdrop. Recall that last week, tensions surrounding Greenland and a possible new trade war between the U.S. and the EU reached their peak. Trump threatened to either forcibly take the island or impose additional tariffs of 10% against some European countries. However, on Wednesday, the situation was resolved at the economic forum in Davos. NATO Secretary General Mark Rutte proposed a solution to Trump, but no one knows the details of this deal. In any case, the tariffs are being canceled, and Trump has reconsidered his plans for the island. The dollar weakened at the beginning of the week and accelerated its decline by the end. This is because the market is tired of the constant imperial threats and ultimatums from the American president, and now mostly reacts to news from the White House by selling the dollar. At the same time, it ignores decent reports from the U.S., even though a long-term upward trend technically remains. Therefore, from any perspective, the dollar should continue to fall in 2026.
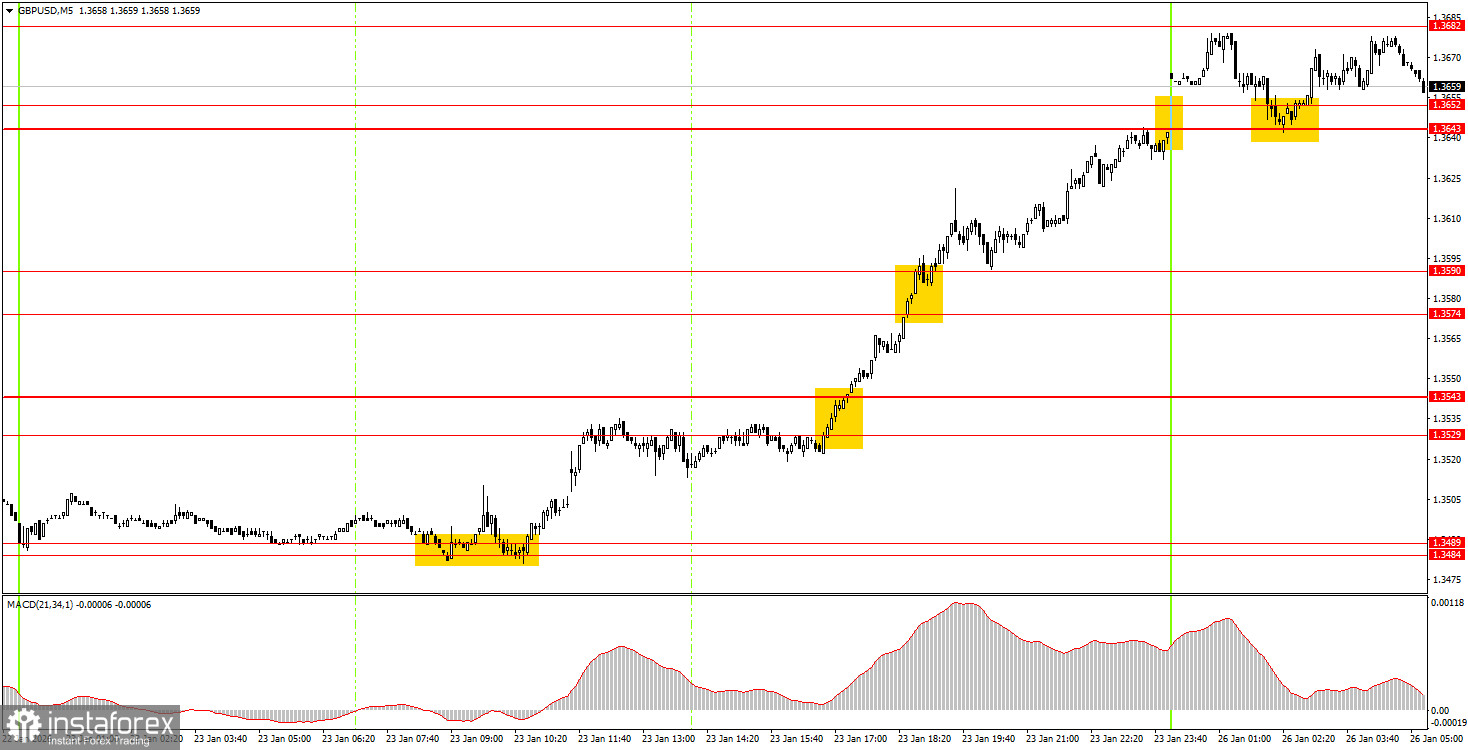
5M Chart of GBP/USD
On the 5-minute timeframe, numerous trading signals were formed on Friday. All were buy signals. The first signal was generated in the morning with a double bounce from the area of 1.3484-1.3489. Thus, beginner traders could open long positions. Subsequently, the areas of 1.3529-1.3543, 1.3574-1.3590, and 1.3643-1.3652 were surpassed. Therefore, by the most modest estimates, from a single long position alone, one could have earned 120-130 pips.
How to Trade on Monday:
On the hourly timeframe, the GBP/USD pair has turned to the upside, so we can expect the British pound to grow in the coming weeks. There are no global foundations for medium-term dollar growth, so in 2026, we expect a resumption of the global upward trend from 2025, which could push the pair to 1.4000 soon. Donald Trump's policy still does not imply strengthening the American currency.
On Monday, beginner traders can consider short positions if the pair consolidates below the 1.3643-1.3652 area, with a target of 1.3574-1.3590. A bounce from the area of 1.3643-1.3652 or a consolidation above the level of 1.3682 will allow for remaining in long positions with a target of 1.3763 or opening new ones.
On the 5-minute timeframe, trading can currently be conducted at 1.3259-1.3267, 1.3319-1.3331, 1.3365, 1.3403-1.3407, 1.3437-1.3446, 1.3484-1.3489, 1.3529-1.3543, 1.3574-1.3590, 1.3643-1.3652, 1.3682, 1.3763, and 1.3814-1.3832. On Monday, there are no important events scheduled in the UK, while the U.S. will release a report on durable goods orders, which is considered important, but, in the current circumstances, the fundamental backdrop remains the market's priority, indicating no strong growth for the dollar.
Main rules of the trading system:
- Signal strength is judged by the time required to form the signal (rebound or breakout). The less time required, the stronger the signal.
- If two or more trades were opened on false signals near a level, then all subsequent signals from that level should be ignored.
- In a flat, any pair can generate many false signals or none at all. In any case, at the first signs of a flat, it is better to stop trading.
- Trades are opened between the start of the European session and the middle of the American session; after that, all trades must be closed manually.
- On the hourly timeframe, MACD-based signals should be traded only when there is good volatility and a trend confirmed by a trendline or trend channel.
- If two levels are located too close to each other (5–20 pips), they should be considered a support or resistance area.
- After the price moves 20 pips in the correct direction, set the stop loss to breakeven.
What is shown on the charts:
Support and resistance price levels — levels that serve as targets when opening buys or sells. Take Profit can be placed near them.
Red lines — channels or trendlines that reflect the current tendency and show which direction is preferable to trade now.
MACD indicator (14,22,3) — histogram and signal line — an auxiliary indicator that can also be used as a source of signals.
Important speeches and reports (always listed in the news calendar) can strongly affect a currency pair's movement. Therefore, during their release, trading should be done with maximum caution, or positions should be closed, to avoid a sharp price reversal against the preceding move.
Beginner forex traders should remember that not every trade can be profitable. Developing a clear strategy and effective money management are the keys to long-term trading success.