Analysis of Thursday's Trades:
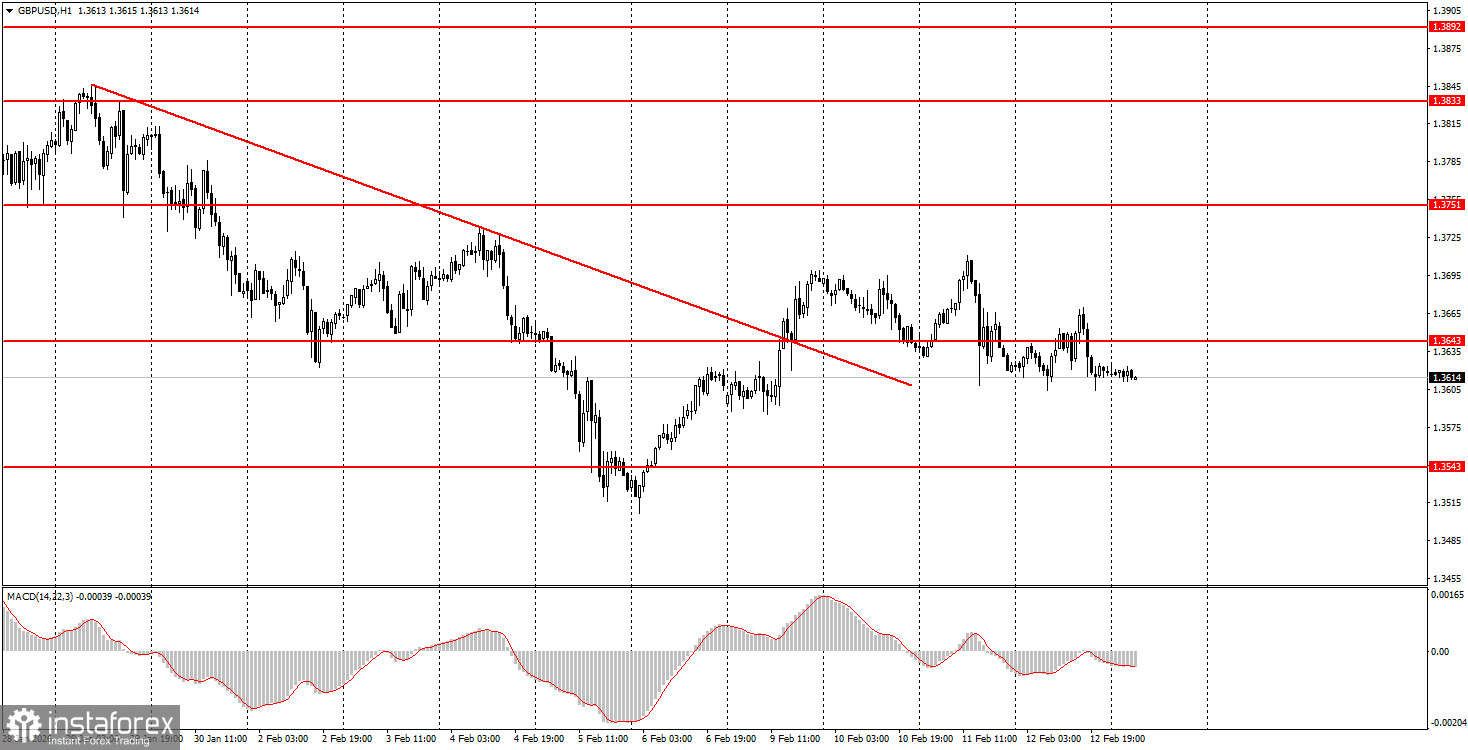
1H Chart of the GBP/USD Pair
The GBP/USD pair also traded predominantly sideways on Thursday, but with slightly greater volatility. In the morning, the UK published data on fourth-quarter GDP and industrial production, once again disappointing admirers of the British pound. However, it is worth reminding that the state of the British economy is even worse than that of the U.S. The British pound has been rising for over a year solely because the U.S. dollar is depreciating. Therefore, another batch of poor data from Great Britain was not surprising. The GDP in the fourth quarter grew by only 0.1%, and industrial production fell by 0.9%. The British pound has been slipping for the third consecutive day, although earlier in the week it managed to break the descending trend line, turning the direction upward. The dollar still has a significant number of factors pointing to a decline, but the market is not rushing into new sales.
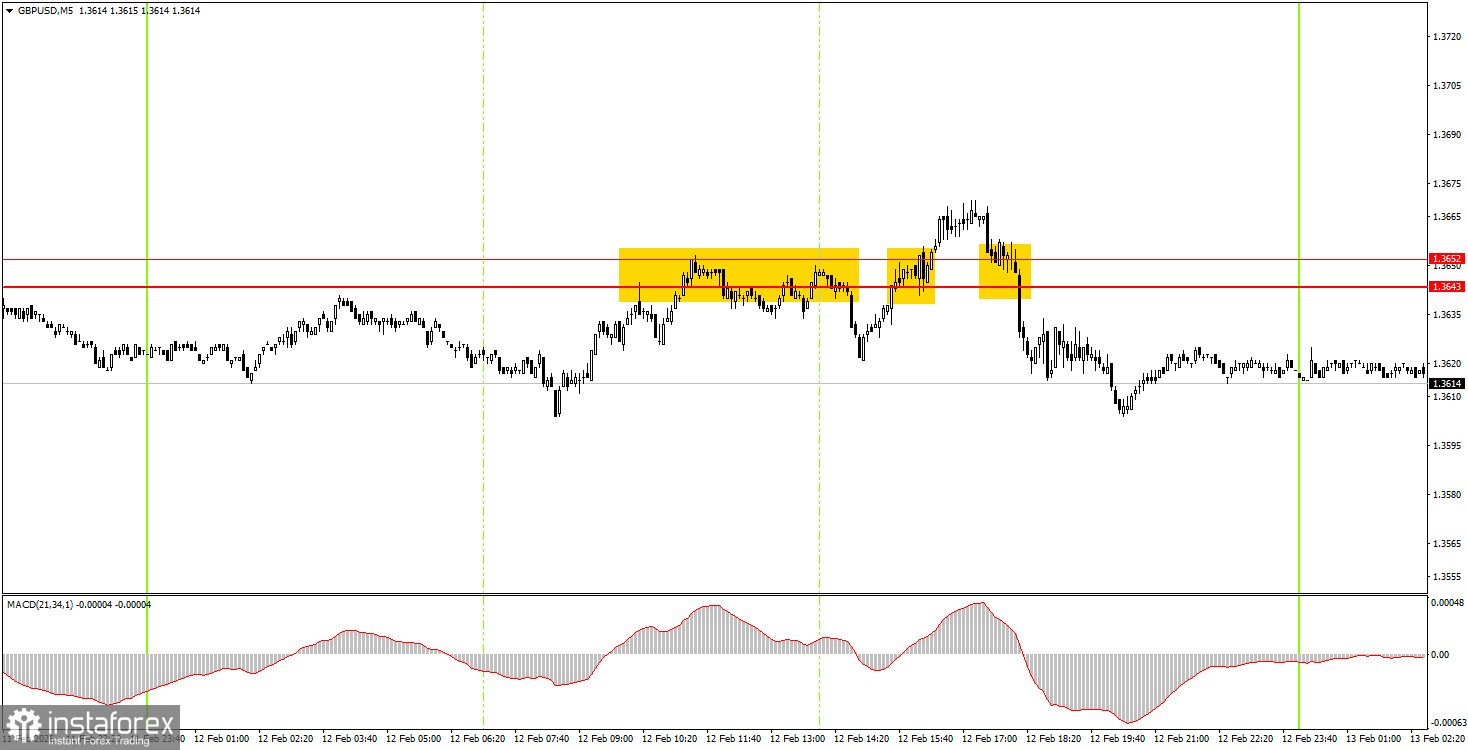
5M Chart of the GBP/USD Pair
On the 5-minute time frame, three trading signals were formed on Thursday, each leaving much to be desired. It is worth noting that the British data had no impact on the pair's movement during the day. The market ignored it, as well as many other reports in recent weeks and months. The first two signals in the area of 1.3643-1.3652 turned out to be false, and the third signal should not have been traded.
How to Trade on Friday:
On the hourly time frame, the GBP/USD pair broke the downward trend. There are no global grounds for medium-term dollar growth; therefore, in 2026, we expect the continuation of the global upward trend from 2025, which could take the pair to at least 1.4000. In recent weeks, the situation has often not favored the British currency, and the market, after a few active weeks, is again falling into a state of lethargy.
On Friday, beginner traders may consider short positions if the pair bounces from the 1.3643-1.3652 area, with a target of 1.3529-1.3543. A consolidation above the area of 1.3643-1.3652 will allow for opening long positions with a target of 1.3741-1.3751.
On the 5-minute time frame, you can now trade at levels 1.3319-1.3331, 1.3365, 1.3403-1.3407, 1.3437-1.3446, 1.3484-1.3489, 1.3529-1.3543, 1.3643-1.3652, 1.3741-1.3751, 1.3814-1.3832, 1.3891-1.3912, and 1.3975. There are no important events scheduled in the UK on Friday, while the U.S. will release another important inflation report. Recall that inflation is currently the top priority for the Federal Reserve. Therefore, this report might stir the market and prevent it from slipping into a new hibernation.
Main Rules of the Trading System:
- The strength of the signal is determined by the time it takes to form (rebound or breaking through the level). The shorter the time, the stronger the signal.
- If two or more trades were opened around a particular level based on false signals, all subsequent signals from that level should be ignored.
- In a flat market, any pair can generate numerous false signals or no signals at all. In any case, it is best to stop trading at the first signs of a flat.
- Trades are opened during the time period between the start of the European session and until the middle of the American session, after which all trades should be manually closed.
- On the hourly timeframe, signals from the MACD indicator should ideally be traded only when there is good volatility and a trend confirmed by a trend line or channel.
- If two levels are too close to each other (ranging from 5 to 20 pips), they should be considered as a support or resistance area.
- After moving 20 pips in the correct direction, it is advisable to set the Stop Loss to break-even.
What's on the Charts:
- Support and resistance levels are targets for opening buy or sell trades. Take Profit levels can be placed around them.
- Red lines indicate channels or trend lines that reflect the current trend and indicate the preferred direction for trading now.
- The MACD indicator (14,22,3) – the histogram and signal line – serves as a supplementary indicator that can also be used as a source of signals.
- Important speeches and reports (always found in the news calendar) can significantly influence the movement of the currency pair. Therefore, during their release, trading should be conducted with maximum caution, or it is advised to exit the market to avoid a sharp price reversal against the preceding movement.
- Beginners trading in the Forex market should remember that not every trade can be profitable. Developing a clear strategy and practicing sound money management are the keys to long-term trading success.