To open long positions on EURUSD, you need:
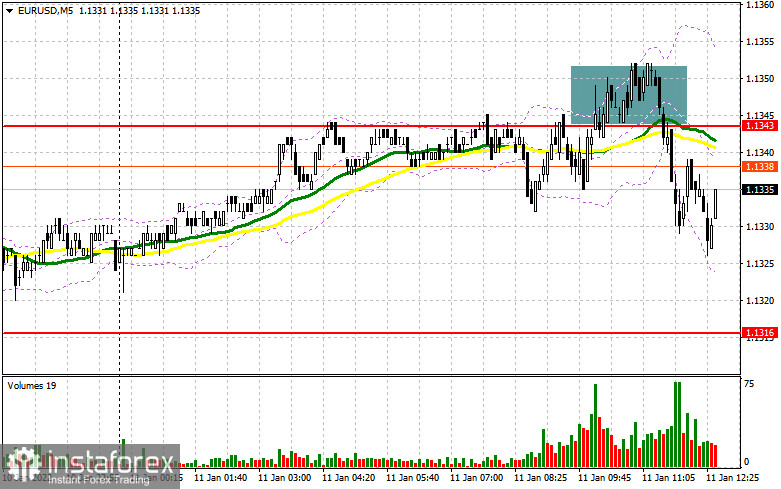
In my morning forecast, I paid attention to the 1.1343 level and made decisions on entering the market. Let's look at the 5-minute chart and figure out what happened. Speeches by representatives of the European Central Bank did not particularly help the euro in the first half of the day, but buyers attempted to break 1.1343. A false breakdown and a return to this level formed an entry point into short positions, which is valid at the time of writing the review. The technical picture changed a little in the afternoon, especially for euro buyers. And what were the entry points for the pound this morning?
During the American session, speeches by representatives of the Federal Reserve System are expected, which may significantly affect the direction of the EUR/USD pair, provided that we are talking about a more aggressive policy of the central bank this year. In the event of a further decline in the euro, only the formation of a false breakdown at 1.1317, by analogy with yesterday, will lead to the formation of a good entry point into long positions. If at the time of the 1.1317 tests the bulls will not be able to offer anything (there will be no active growth of the pair), it is better not to rush with long positions. A break of this channel boundary may lead to a larger sell-off. In this case, I advise buying EUR/USD only after updating the next support at 1.1294, where yesterday it was possible to observe the active actions of bulls. However, I also advise entering the market there only if a false breakdown is formed. You can immediately open long positions for a rebound from the minimum in the area of 1.1273 with the aim of an upward correction of 15-20 points within the day. An equally important task for euro buyers remains the return to control of the 1.1343 level, which could not be done in the first half of the day. A breakout and consolidation above this range will certainly return the appetite for risks, which will form an excellent entry point for buying EUR/USD to update the upper limit of the 1.1363 channel. Going beyond this range can seriously affect the direction of the EUR/USD pair, so be very careful at this level. A breakout and a top-down test of 1.1363 will lead to a larger increase in the area of the highs: 1.1385 and 1.1415. A more distant target will be the 1.1442 level, where I recommend fixing the profits.
To open short positions on EURUSD, you need:
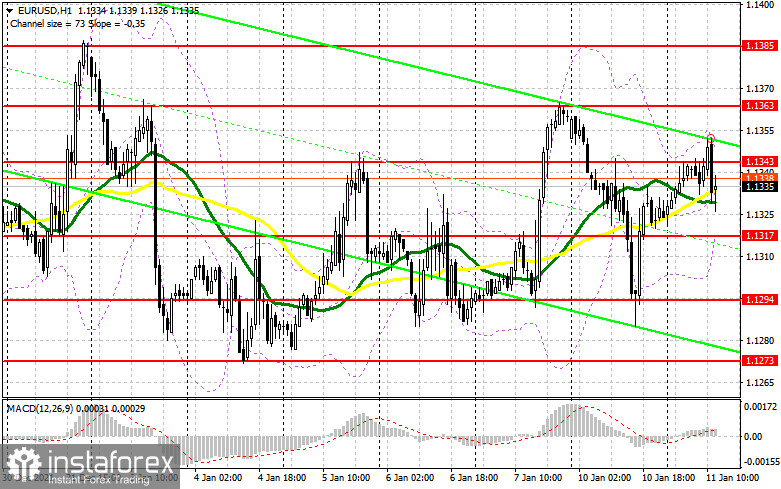
Sellers have made it clear that they are not going to leave the market anywhere, especially to release the euro for a repeat resistance test of 1.1363. While trading will be conducted below 1.1343, we can count on a larger drop in the pair - especially during the speech of Federal Reserve Chairman Jerome Powell. In the case of EUR/USD growth during the American session, the same optimal scenario for selling the euro will be the formation of a false breakdown at 1.1343, which forms an additional entry point into short positions with the prospect of a repeat collapse to the support area of 1.1317. A breakdown and a reverse test from the bottom up of this range after the speech of the Fed representatives will give an additional signal to enter the market, which will push the pair to a minimum of 1.1294 and open a direct road to 1.1273. A more distant target will be the 1.1248 area, where I recommend fixing the profits. If the pair recovers during the American session and bears are inactive at 1.1343, the optimal scenario will be sales after the formation of a false breakdown near the upper boundary of the 1.1363 side channel. It is possible to open short positions on EUR/USD immediately for a rebound from the highs: 1.1385 and 1.1415 with the aim of a downward correction of 15-20 points.
The COT report (Commitment of Traders) for January 4 recorded a sharp increase in long positions and a reduction in short ones, which led to a change in the negative value of the delta. This suggests that the market is gradually changing and the demand for the European currency, despite the expected changes in the policy of the Federal Reserve System, has not gone away. This week we are waiting for a report on inflation in the United States, which can put all the "dots over", as it is expected to grow above 7% per annum. Such a scenario will lead to more active actions by the US central bank about interest rates. Given that things are going quite well in the American labor market, we can count on at least four interest rate hikes this year. Meanwhile, the European Central Bank, although it plans to fully complete its emergency bond purchase program in March this year, however, the regulator is not going to take any other actions aimed at tightening its policy, which limits the upward potential of risky assets. The COT report indicates that long non-commercial positions rose from the level of 196,595 to the level of 199,073, while short non-commercial positions fell from the level of 206,757 to the level of 200,627. This suggests that traders will continue to increase long positions on the euro in the expectation of continuing the upward correction of the pair. At the end of the week, the total non-commercial net position decreased its negative value from -10,162 to -1554. The weekly closing price rose slightly and amounted to 1.1302 against 1.1277 a week earlier.
Signals of indicators:
Moving averages
Trading is conducted around 30 and 50 daily moving averages, which indicates market uncertainty.
Note: The period and prices of moving averages are considered by the author on the hourly chart H1 and differ from the general definition of the classic daily moving averages on the daily chart D1.
Bollinger Bands
In the case of growth, the upper limit of the indicator around 1.1340 will act as resistance. A break of the lower limit of the indicator in the area of 1.1317 will lead to a larger drop in the pair.
Description of indicators
- Moving average (moving average determines the current trend by smoothing out volatility and noise). Period 50. The graph is marked in yellow.
- Moving average (moving average determines the current trend by smoothing out volatility and noise). Period 30. The graph is marked in green.
- MACD indicator (Moving Average Convergence / Divergence - moving average convergence/divergence) Fast EMA period 12. Slow EMA period 26. SMA period 9
- Bollinger Bands (Bollinger Bands). Period 20
- Non-profit speculative traders, such as individual traders, hedge funds, and large institutions that use the futures market for speculative purposes and meet certain requirements.
- Long non-commercial positions represent the total long open position of non-commercial traders.
- Short non-commercial positions represent the total short open position of non-commercial traders.
- Total non-commercial net position is the difference between the short and long positions of non-commercial traders.